
Protein bars compared
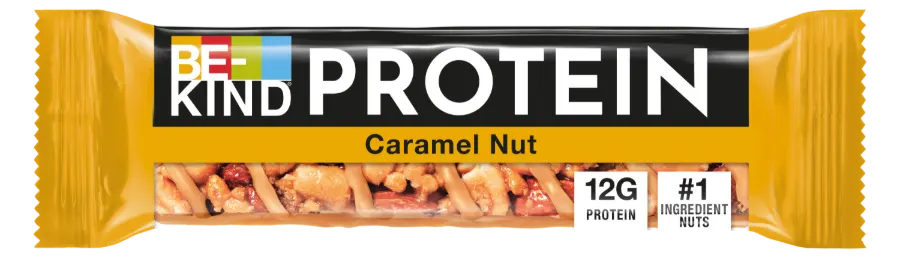
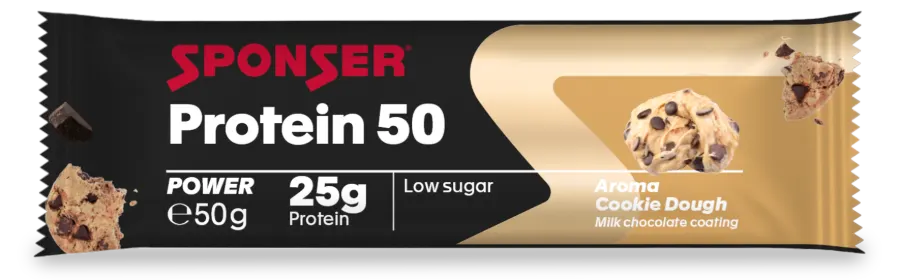
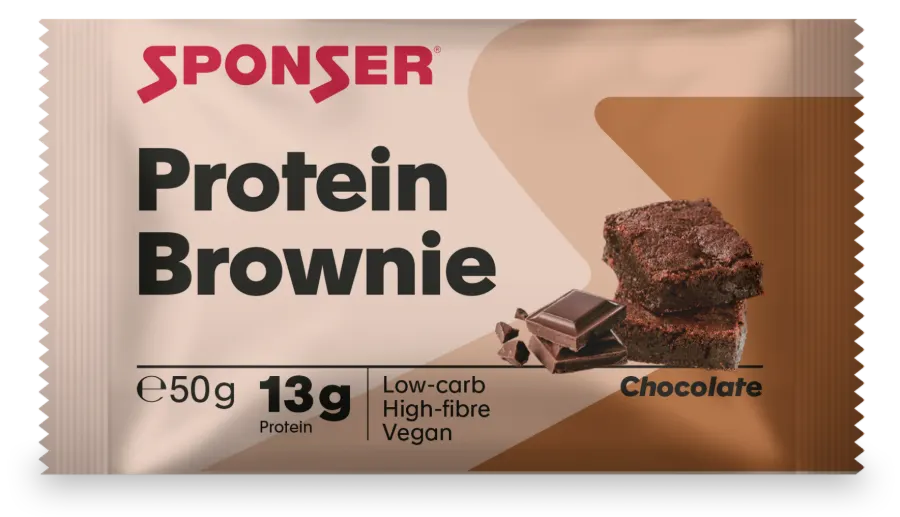
Protein bars differ above all in their protein and sugar content. A nut-based bar delivers more fat and more energy, a bar with a protein coating delivers more protein with considerably less sugar. The nutrition values appear in the same table and are calculated per 100 grams, so the models can be compared directly.
| Property |  from |  from |  from |
|---|---|---|---|
| Properties | |||
| Flavour | Caramel Nut, Crunchy Peanut Butter, Dark Chocolate Nut, Dark Chocolate Raspberry | Chocolate, Cookie Dough | Chocolate |
| Packaging | not specified | Display, Bar | Display, Bar |
| Net quantity (weight) | 50 g | 50 g | 50 g |
| Units per pack | not specified | 20–25 | 12 |
| Nutrition | |||
| Energy (kJ) | 2124–2228 kJ | 1343–1534 kJ | 1524 kJ |
| Energy (kcal) | 511–535 kcal | 320–367 kcal | 364 kcal |
| Fat | 33–34 g | 6.8–12 g | 12 g |
| of which saturates | 7–7.9 g | 3.1–6.5 g | 7.2 g |
| Carbohydrates | 22–31 g | 20–21 g | 34 g |
| of which sugars | 15–17 g | 1.4–1.5 g | 12 g |
| of which polyols | not specified | 17–19 g | not specified |
| Protein | 23–25 g | 50 g | 26 g |
| Salt | 0.23–0.62 g | 0.31–0.84 g | 0.7 g |
| Dietary fibre | 6.5–13 g | 5.7 g | 10 g |
| Minerals | |||
| Phosphorus | not specified | 220 mg | not specified |
| Chrom(e) | not specified | 30 µg | not specified |
| Vitamins | |||
| Vitamin E | not specified | 3.6 mg | not specified |
| Vitamin B1 | not specified | 0.33 mg | not specified |
| Vitamin B2 | not specified | 0.42 mg | not specified |
| Vitamin B6 | not specified | 0.42 mg | not specified |
| Vitamin B12 | not specified | 0.75 µg | not specified |
| Niacin | not specified | 4.8 mg | not specified |
| Biotin | not specified | 15 µg | not specified |
| Pantothensäure | not specified | 1.8 mg | not specified |
Nutrition values are given per 100 g and converted to the same quantity for every model. Ranges show the lowest and highest value across a model’s flavours. The label on the packaging always applies.